Discussion of the Results
In this chapter the results of simulating the different scenarios are beeing summarized. In the following the results for each component are discussed. Furthermore the effect of the controlling is discussed.
Results of the Transformer
The loading of the transformer for the different scenarios is given in the following Figure 8:
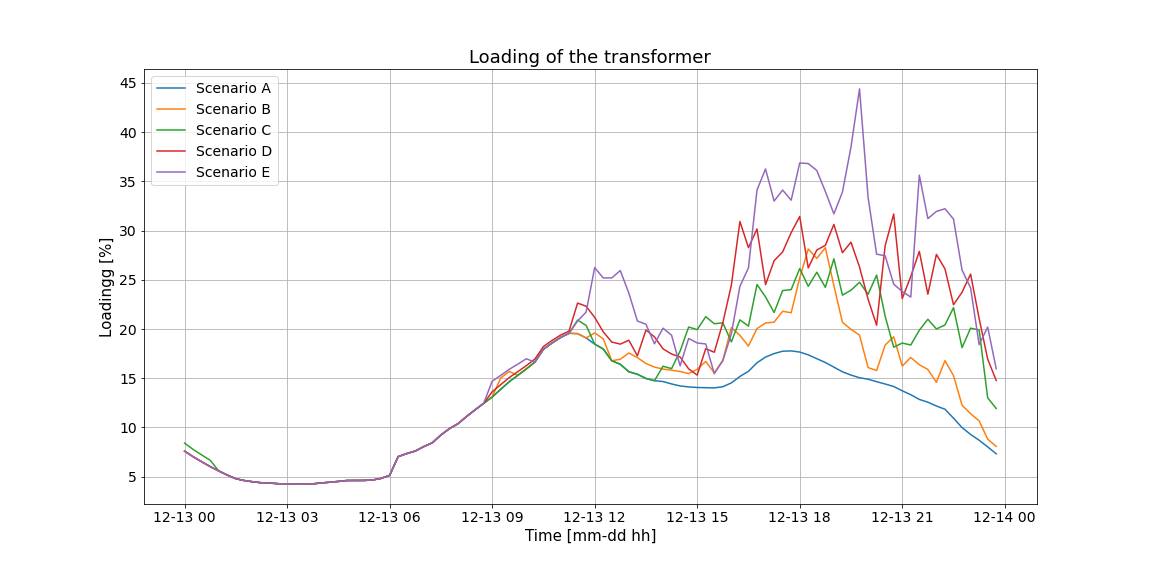
Fig. 8 Simulation results for the transformer
It is to see, that the peak loading keeps getting bigger with higher penetrations of BEV. Also the peak in the evening hours corresponds to the distribution of arrival times depicted in Figure 5. The most people arrive in the evening and start charging their BEV, thus causing the highest peak in the evening.
Results of the most loaded Line
The loading of the most loaded line for the different scenarios is given in the following Figure 9:
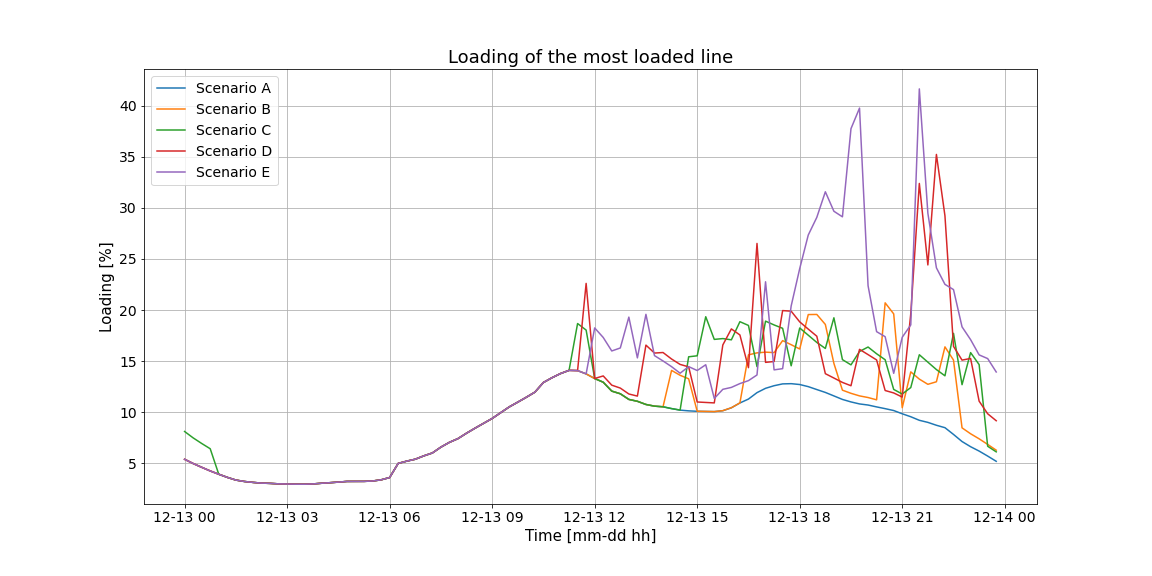
Fig. 9 Simulation results for the most loaded line
The most loaded line is line nr. 220, the line going from the main busbar to the netbeam with 32 loads attached (as depicted in Figure 2). Here is also to see the peak in the evening hours, when the most people arrive at home and start loading their BEV. The peak loading increases with higher penetrations of BEV.
Results of the most loaded Node
The Voltage at the most loaded nodes for the different scenarios is given in the following Figure 10:
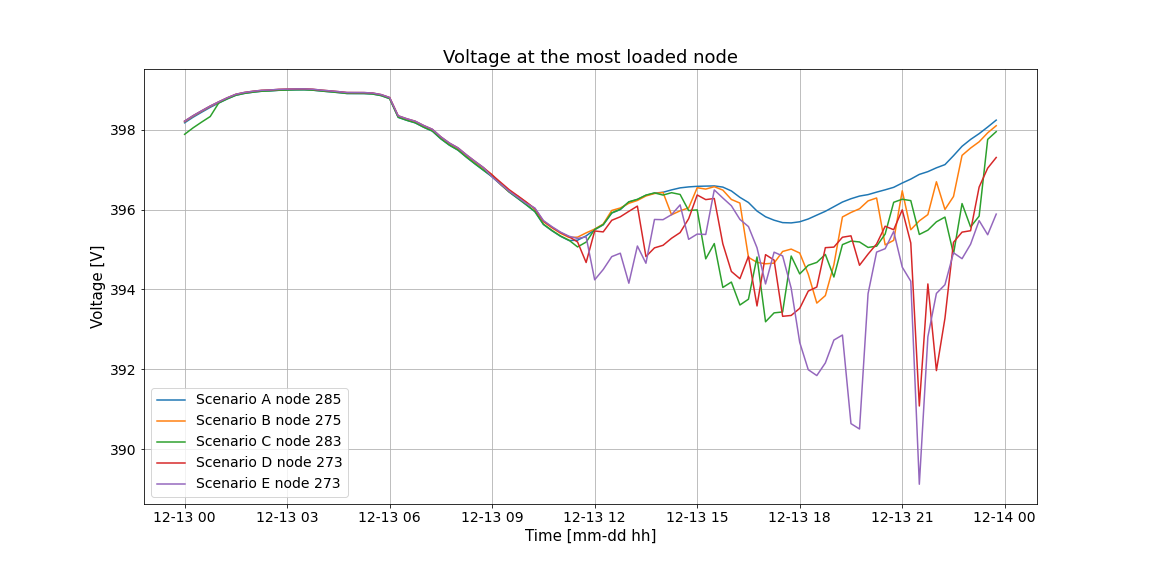
Fig. 10 Simulation results for the most loaded nodes
Notice the changing nodes for different scenarios (these are always nodes near the end of a netbeam). They all have in common, that the deepest voltage drop occurs in the evening hours (when the most people arrive at home and start loading their BEV). It is to see, that the maximum voltage drop keeps increasing for higher penetrations of BEVs.
Results of the controlling
The following Figure 11 shows the voltage at the most loaded node for the worst-case-scenario with and without controlling:
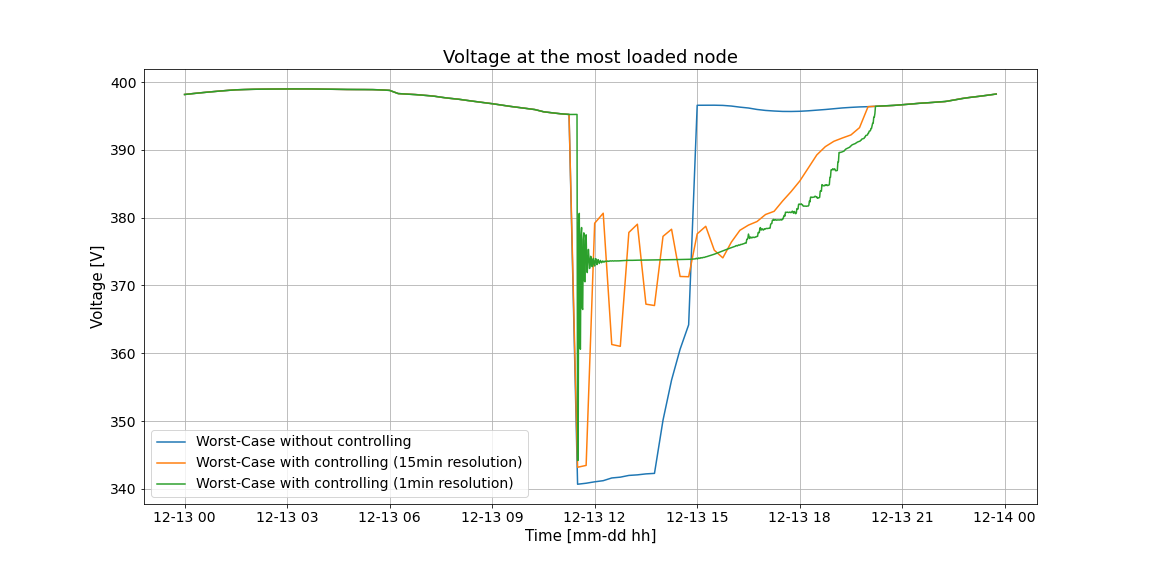
Fig. 11 Simulation results for the controlling
Without active controlling the voltage drops to about 340V, staying there until all BEVs are loaded. With controlling activated, the controller brings the voltage back to 376V and thus in a tolerable voltage band. In case of the 15 minute resolution the transient response takes almost as long as the whole charging. However, in case of the 1 minute resolution the transient response is much quicker.