Methodology for Research
In this chapter the methodology used for investigating the influences of BEV loading on the local grid is beeing discussed. This methodology is separated into 7 parts:
choosing and implementing a reference grid
choosing and implementing of a standard load profile (SLP) for the households
implementing a model for charging of BEV battery
choosing and implementig of a distribution of arrival times for BEVs
choosing and implementing of a distribution for the travelled distances
choosing and implementing of a distribution for the nominal powers of the charging stations
additionally a controller is beeing designed
The Reference Grid
The reference grid used for the simulation is a kerber network as it is provided by pandapower. The following Figure 2 shows a schematic plot of the grid:
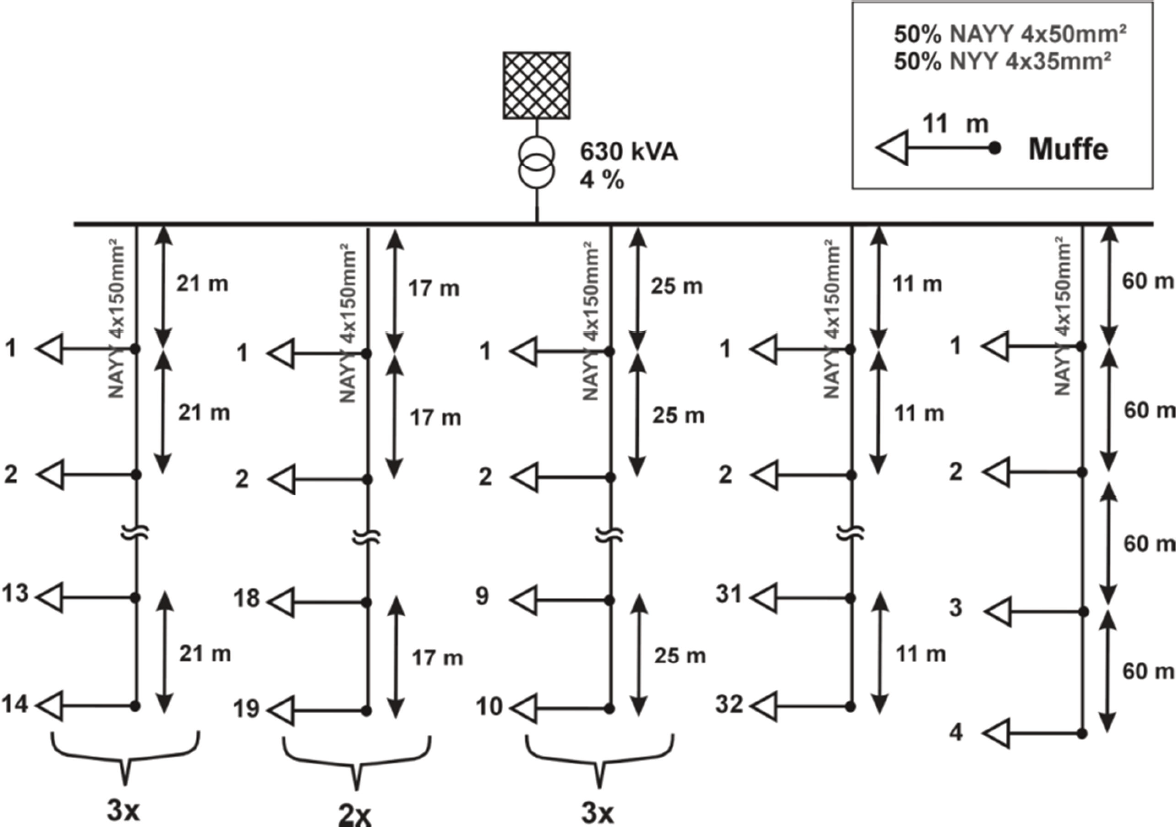
Fig. 2 The kerber network used for simulation
This network represents the average network in German suburbs as derived in [Ker11]. All the loads attached are households.
The Standard Load Profile
As a SLP serves a profile “H0A” of N_ERGIE netz of 2020, which represents the load of a household. The day with the highest power demand is the 13.12.2020. This day was choosen for the simulation. The following Figure 3 shows the SLP:
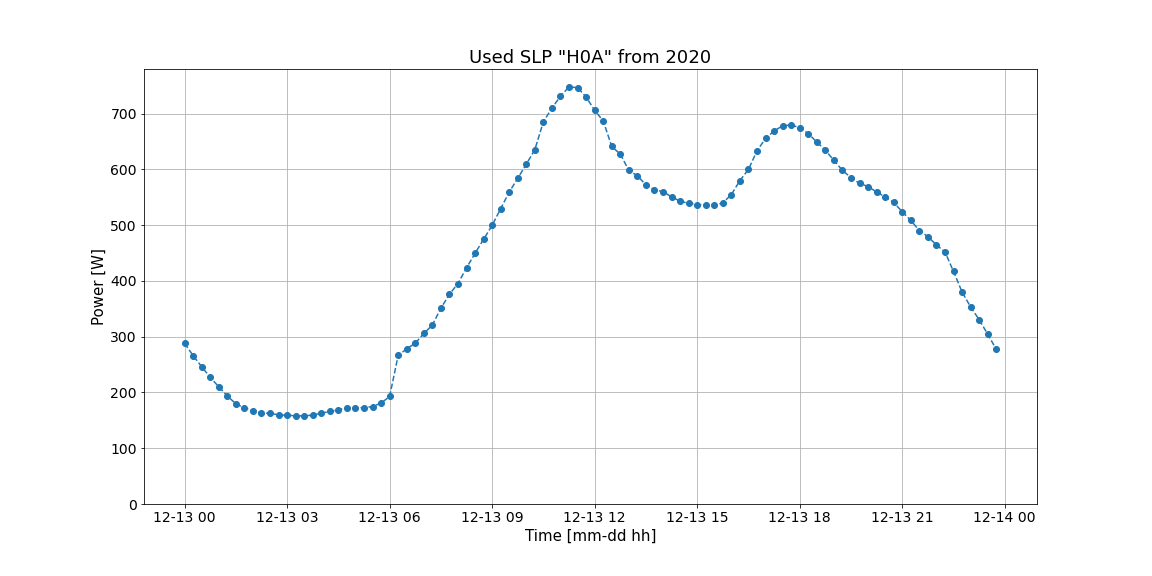
Fig. 3 Load profile of the used SLP
The values are considered to be real power.
The Model for charging BEV battery
The charging of the BEV battery is modelled according to [Sch08] wich is given by the following equations:
With the symbols beeing:
Symbol |
Meaning |
Unit |
|---|---|---|
\(P\) |
Power |
\(W\) |
\(P_{max}\) |
Maximum Power |
\(W\) |
\(s\) |
Switching Point |
\(\%\) |
\(SOC\) |
State of Charge |
\(\%\) |
\(U_{LS}\) |
Load-stop Voltage |
\(V\) |
\(U_N\) |
Nominal Voltage |
\(V\) |
\(I_{LS}\) |
Load-stop Current |
\(\frac{1}{h}\) |
\(E_N\) |
Nominal Energy |
Wh |
The Nominal Voltage of Lithium-Ion-Batteries is expected to be \(U_N= 3.9V\), the Load-stop Voltage is taken as \(U_{LS}=4.2V\), the Load-stop Current is taken as \(I_{LS} = 0.03 \frac{1}{h}\) (c-rate) and the Switching Point is taken as \(s = 80\%\).
The following Figure 4 shows the loading curve as described by Equation (1):
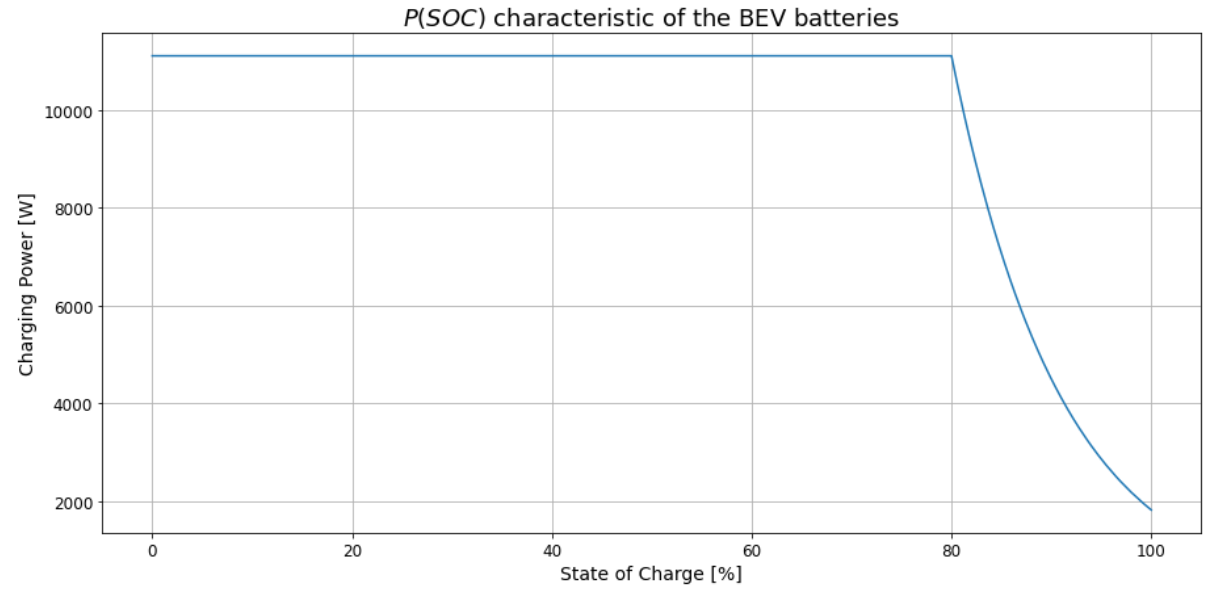
Fig. 4 Characteristic of the BEV batteries loading
It is to see, that the initial charging power is determined by the initial state of charge \(SOC_0\), which is calculated in dependence of the travelled distance \(d\) and the consumption \(c\) according the following Equation (4):
The state of charge in the next discrete timestep \(SOC_{n+1}\) is calculated in dependence of the timestep \(\Delta t\) according the next Equation (5):
The Distribution of Arrival Times
The distribution of arrival times is beeing adopted from [Dou15]. The following Figure 5 shows the distribution:
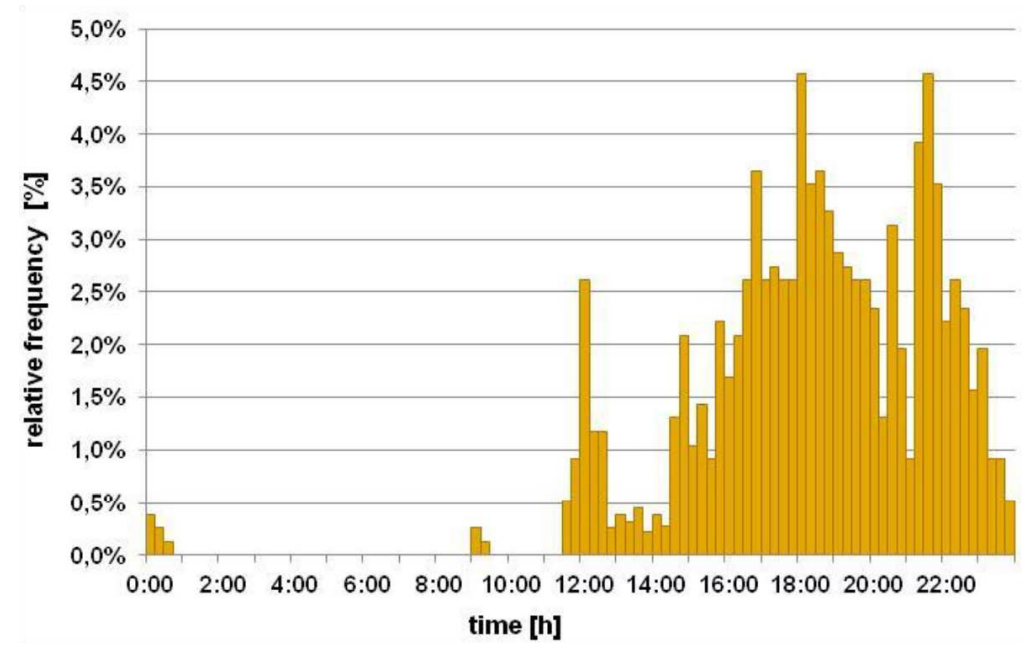
It ist to see, that most people arrive at 18:00 and there is also another peak at 22:00.
The Distribution of travelled Distances
The distribution of the travelled distances is taken from [sta]. The vaues provided for 2020 are downscaled to one day (assuming 365 days driving per year). These downscaled values are given in the following Table 3:
Distance travelled [km] |
Probability [-] |
|---|---|
7 |
0.13 |
21 |
0.29 |
35 |
0.30 |
50 |
0.15 |
60 |
0.13 |
These values determine the \(d\) in Equation (4). Furthermore the mean consumption of BEVs is taken as \(c=17.7 \frac{kWh}{100km}\) and the battery capacity as \(E_{nom}=52kWh\) (Values of the most sold BEV [ADA] according to [Ren]).
The Distribution of the Nominal Power of the Charging Stations
The distribution is taken from [goi], only taken into account the first three categories. This results in the values given in the following Table 4:
Charging power [kW] |
Probability |
|---|---|
3.7 |
0.35 |
11.1 |
0.55 |
22.2 |
0.10 |
These values determine the \(P_{max}\) in Equation (1).
The controller
As a controller serves as a \(P(U)\) controlling according the characteristic in the following Figure 6:
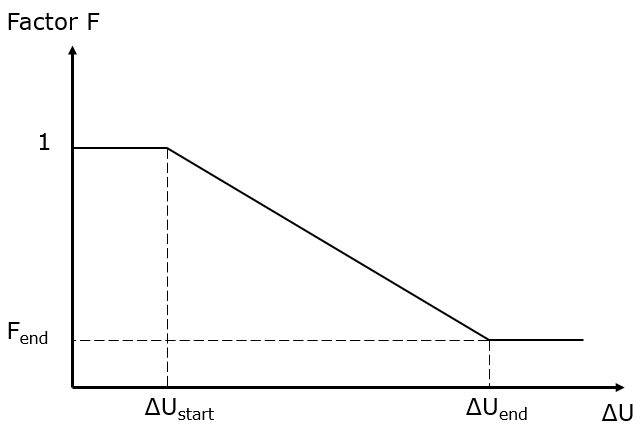
Fig. 6 Characteristic of the controller
The characteristic represents the P-element of the controller. The voltage drop \(\Delta U\) is defied according Equation (6):
Furthermore an I-element is used defined in Equation (7):
And additionally a D-Element contributes to the controller according to Equation (8):
This results in a controlled power \(P_{control}\) according to Equation (9):
The complete control loop is shown in the following Figure 7.
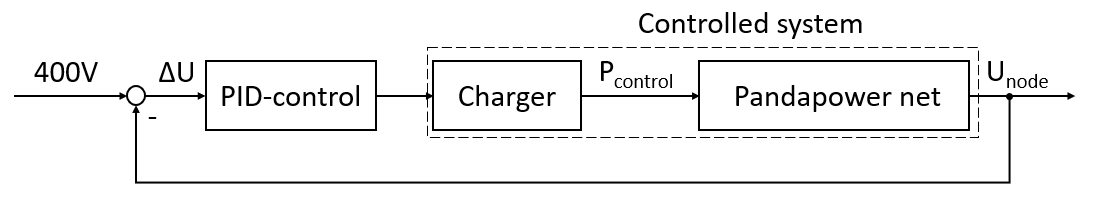
Fig. 7 Controller loop
The following Table 5 list all the adjustable parameters of the controller:
Parameter |
Meaning |
Default value |
|---|---|---|
\(F_{end}\) |
Factor at \(\Delta U_{end}\) |
0.4 |
\(\Delta U_{start}\) |
Voltage to start to lower charging power |
0.01 |
\(\Delta U_{end}\) |
Voltage to stop to lower charging power |
0.06 |
\(K_D\) |
Differential proportionality factor |
0 |
\(K_I\) |
Integration proportionality factor |
0.5 |
\(n\) |
Number of last values to calculate integral |
15 |
Bibliography
- ADA
Elektroautos: Besser spät als nie. URL: https://www.adac.de/rund-ums-fahrzeug/elektromobilitaet/info/elektroauto-bilanz/ (visited on 2021-06-19).
- sta
Jährliche Fahrleistung des PKW in Deutschland 2020. URL: https://de.statista.com/statistik/daten/studie/183003/umfrage/pkw---gefahrene-kilometer-pro-jahr/ (visited on 2021-07-01).
- Ren
RENAULT ZOE E-TECH 100% elektrisch. URL: https://www.renault.de/elektromodelle/zoe.html (visited on 2021-06-17).
- Dou15(1,2)
Thorben Doum. Notwendigkeit und Rahmenbedingungen eines Lastmanagements in Niederspannungsnetzen. Technische Hochschule Köln, 2015. URL: http://www.100pro-erneuerbare.com/netze/publikationen/2015-06-Doum/Doum-Lastmanagement_Elektromobilitaet.htm (visited on 2021-07-17).
- goi
goingElectric. Stromtankstellen Statistik Deutschland. URL: https://www.goingelectric.de/stromtankstellen/statistik/Deutschland (visited on 2021-06-23).
- Ker11
Georg Kerber. Aufnahmefähigkeit von Niederspannungsverteilnetzen für die Einspeisung aus Photovoltaikkleinanlagen. Technische Universität München, pages 150, 2011.
- Sch08
Andreas Schuster. Batterie- bzw. Wasserstoffspeicher bei elektrischen Fahrzeugen. Technische Universität Wien, 2008. URL: https://repositum.tuwien.at/handle/20.500.12708/12337 (visited on 2021-08-20).