Introduction
Background
import matplotlib.pyplot as plt
import numpy as np
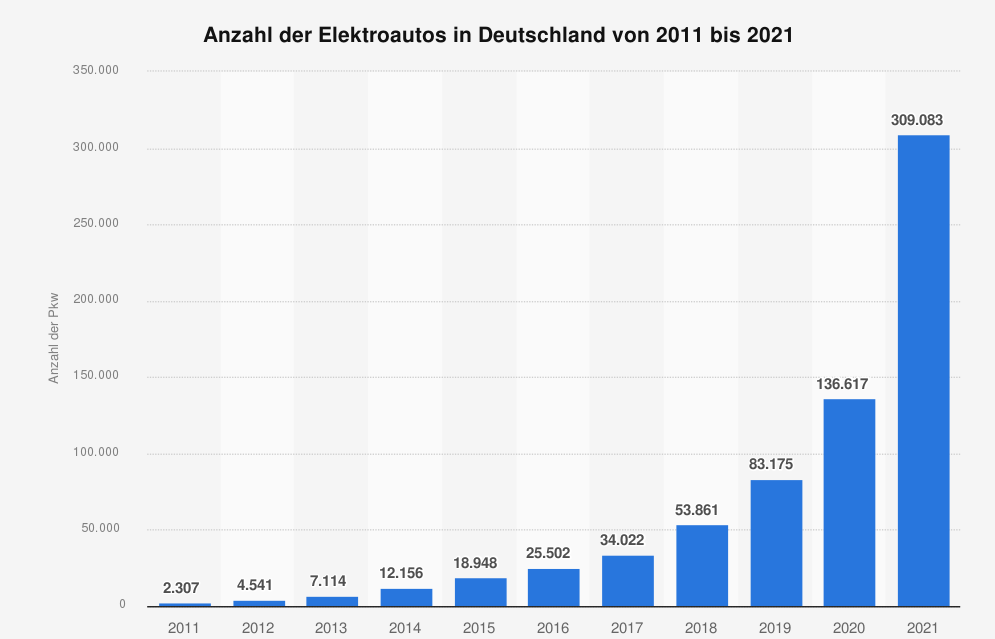
A further growth in electric mobility is to be expected in the future. The number of registered BEV has significantly risen since 2010, as the following Figure 1 shows:
The rise in the number of registered BEVs seems to be exponential. The following example shows what numbers to expect in the future:
years = np.linspace(2011, 2021, 11)
bevs = np.array([2307, 4514, 7114, 12156, 18948, 25502, 34022, 53861, 83175, 136617, 309083])

%config InlineBackend.figure_format ='retina'
plt.figure(figsize=(12,8))
plt.bar(years, bevs, label='available data')

years_prog = np.linspace(2020, 2030, 11)
bevs_prog = (bevs[-1] - bevs[-2])*(years_prog-years_prog[0])+bevs[-2]

plt.plot(years_prog, bevs_prog, '--x', color='black', label='constant growth')
plt.bar(years_prog[-1], bevs_prog[-1], color='red', label='prediction in 2030')
plt.xticks(ticks=list(range(2010, 2031, 2)), fontsize=12)
plt.yticks(fontsize=12)
plt.xlabel('years', fontsize=13)
plt.ylabel('number of registered BEVs', fontsize=13)
plt.title('prediction of registered BEVs in Germany', fontsize=15)
plt.legend(fontsize=13)
plt.grid()
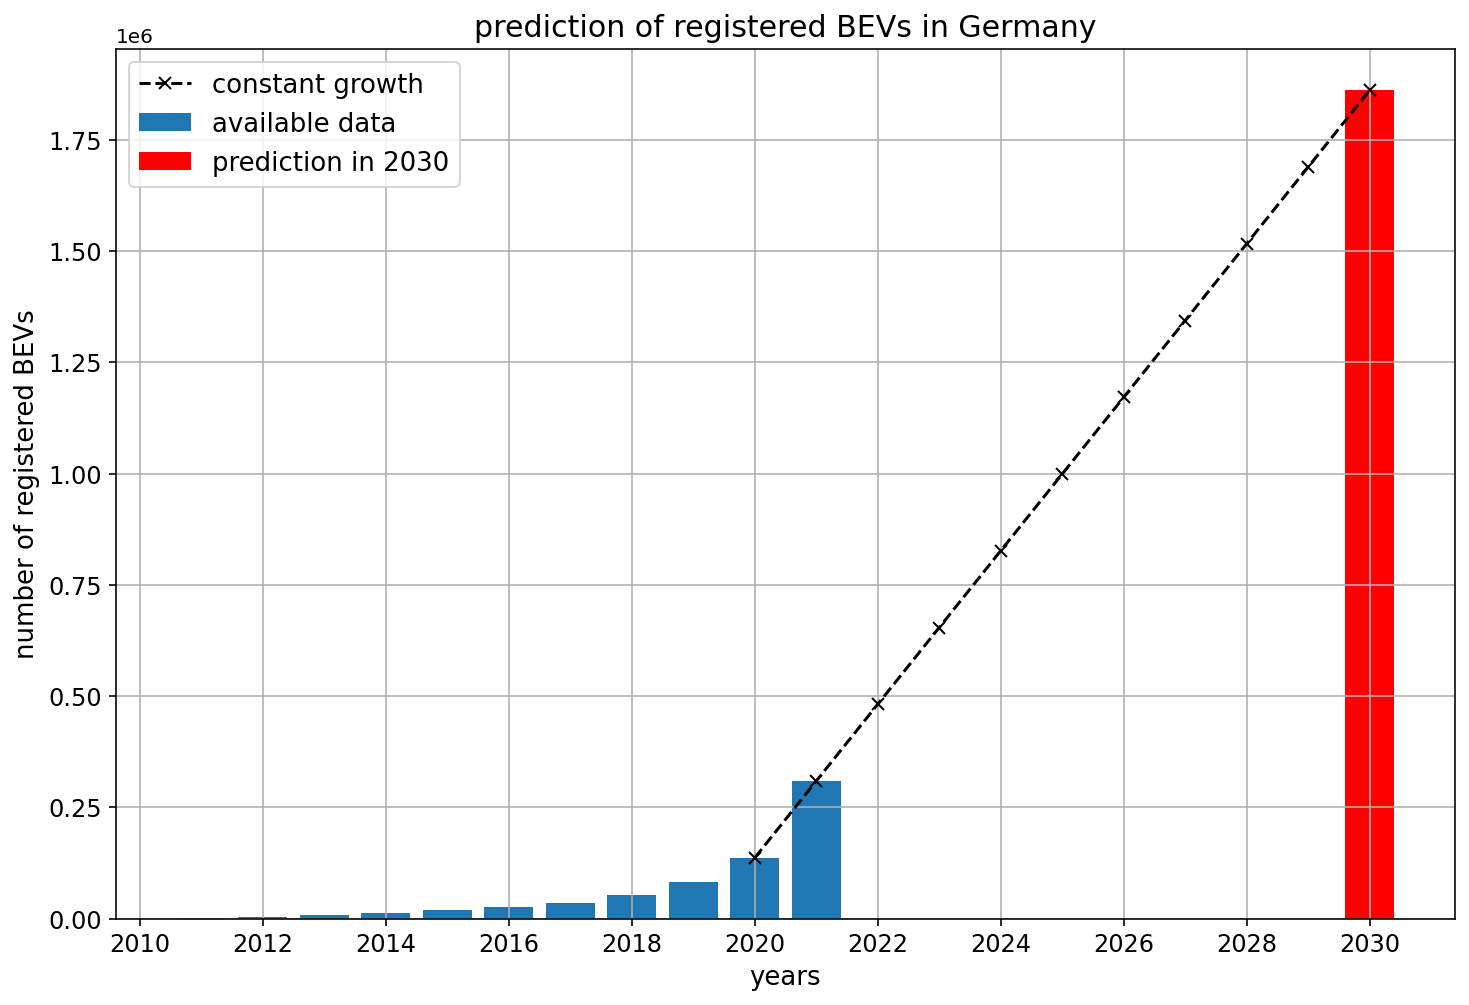
If the growth from 2020 to 2021 keeps on lasting till 2030, there will be 1.8 million registered BEVs in Germany. If the growth keeps on growing, the number is going to be even larger. When the BEVs load, this leads to a new stress for the grid.
Goal of this Work
Goal of this work is to study the effects of different levels of penetration of BEVs in suburban areas on the stability of the grid. Therefor a python tool using pandapower is beeing developed to simulate the grid. For modelling different levels of penetration of BEVs, some scenarios are beeing introduced.
Stability of the Grid:
To assess the stability of the grid, the following parameters given in Table 1 are beeing observed:
Parameter |
Criterion |
|---|---|
Loading of the transformer |
\(< 100 \%\) |
Loading of the most loaded line |
\(< 100 \%\) |
Voltage of the most loaded node |
\(> 376 V\) |
Simulated Scenarios:
The following Scenarios in Table 2 are beeing considered to model different levels of penetration of BEVs:
Scenario |
Penetration |
|---|---|
A |
0% |
B |
30% |
C |
50% |
D |
80% |
E |
100% |
Where the penetration indicates the share of households with a BEV and a charging station.
Bibliography
- noa
Anzahl Elektroautos in Deutschland. URL: https://de.statista.com/statistik/daten/studie/265995/umfrage/anzahl-der-elektroautos-in-deutschland/ (visited on 2021-06-21).